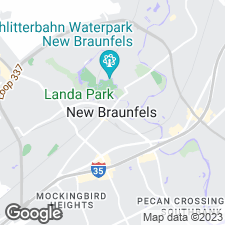
Rental market snapshot for Cibolo, Texas
Cibolo, Texas Rental Property Market Overview
Cibolo, Texas is a vibrant city located in Guadalupe County, with a population of 33,475 as of 2021 according to the US Census. The city is known for its strong sense of community and its commitment to providing quality services to its residents. Cibolo is home to a variety of businesses, restaurants, and entertainment venues, as well as a number of parks and recreational areas. The city is also home to a number of schools, making it a great place to raise a family. With its strong sense of community and commitment to providing quality services, Cibolo is an ideal place to live. (Source: US Census, 2021)
The average rent for an apartment in Cibolo is $2,115. The cost of rent varies depending on several factors, including location, size, and quality.
The average rent has decreased by 0.00% over the past year.
Last Updated March 25, 2024
Get updates straight to your inbox
Whenever this data is updated, you'll be the first to know. Don't miss out on crucial market insights.
Average monthly rent graph in Cibolo Texas | Cost of Living
We currently do not have this data but we are working to add this soon.
- The most expensive ZIP code in Cibolo is 78108 with an average price of $2,041.
- The cheapest ZIP code in Cibolo is 78108 with an average price of $2,041.
Cibolo ZIP codes with the highest, most expensive rent
| # | ZIP Code | Average Rent |
|---|---|---|
| 1 | 78108 | $2,041 |
Live near Cibolo, Texas's Top Sights and Attractions
Schlather Park is a sprawling outdoor recreation area located in Cibolo, Texas. It features a variety of activities, including a large playground, a walking trail, a fishing pond, and a disc golf course. The park also has several picnic areas, a pavilion, and a concession stand. The park is a great place to spend a day outdoors, with plenty of room to run and play.
Niemietz Park is a sprawling outdoor recreation area located in the Texas Hill Country. It features a variety of amenities, including a playground, picnic areas, walking trails, a fishing pond, and a disc golf course. The park also has a large pavilion, perfect for hosting events, and a covered stage for outdoor concerts. With its lush green lawns, towering trees, and picturesque views, Niemietz Park is a great place to spend a day outdoors.
Veterans Memorial Park is a beautiful outdoor space located in Cibolo, Texas. It features a large pond, walking trails, and a variety of memorials honoring veterans from all branches of the military. The park also includes a playground, picnic areas, and a pavilion. The park is a great place to relax and reflect on the sacrifices of our veterans.
Crescent Bend Nature Park is a tranquil oasis located in the heart of Texas. The park features a variety of outdoor activities, including hiking, biking, fishing, bird watching, and picnicking. The park is home to a variety of wildlife, including deer, armadillos, and a variety of birds. The park also features a boardwalk, which winds through the park and offers stunning views of the surrounding area. The park also features a playground, picnic tables, and a pavilion, making it a great spot for families to enjoy a day outdoors.
Cibolo, Texas area median rent change by ZIP code map
We currently do not have this data but we are working to add this soon.
Get updates straight to your inbox
Whenever this data is updated, you'll be the first to know. Don't miss out on crucial market insights.
How does Cibolo compare to other cities in Texas?
| city | median price |
|---|---|
| Weatherford | $2,220 |
| Red Oak | $2,195 |
| Lavon | $2,100 |
| Richmond | $1,980 |
| Farmersville | $1,910 |
| Richardson | $1,850 |
| Greenville | $1,500 |
| Galena Park | $1,425 |
Average household income in Cibolo area graph - US Census
We currently do not have this data but we are working to add this soon.
Get updates straight to your inbox
Whenever this data is updated, you'll be the first to know. Don't miss out on crucial market insights.
The median household income in Cibolo in 2021 was $106,654. This represents a 16.9% change from 2011 when the median was $91,238.
| # | category | percent |
|---|---|---|
| 0 | Less than $10,000 | 3.2% |
| 1 | $10,000 to $14,999 | 0.8% |
| 2 | $15,000 to $19,999 | 1.3% |
| 3 | $20,000 to $24,999 | 0.6% |
| 4 | $25,000 to $29,999 | 0.7% |
| 5 | $30,000 to $34,999 | 1.7% |
| 6 | $35,000 to $39,999 | 1.2% |
| 7 | $40,000 to $44,999 | 4.9% |
| 8 | $45,000 to $49,999 | 1.6% |
| 9 | $50,000 to $59,999 | 5.1% |
| 10 | $60,000 to $74,999 | 9.9% |
| 11 | $75,000 to $99,999 | 17.9% |
| 12 | $100,000 to $124,999 | 14.0% |
| 13 | $125,000 to $149,999 | 13.1% |
| 14 | $150,000 to $199,999 | 15.0% |
| 15 | $200,000 or more | 8.9% |
Neighborhoods in Cibolo
We currently do not have this data but we are working to add this soon.
