Rental market snapshot for Rochester, Pennsylvania
Rochester, Pennsylvania Rental Property Market Overview
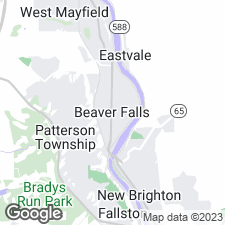
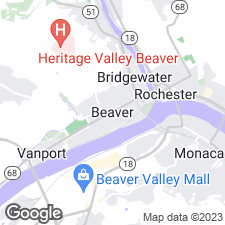
Rochester, Pennsylvania is a small borough located in Beaver County. According to the US Census, the population of Rochester was 3,437 as of 2021. The borough is known for its historic downtown area, which features a variety of shops and restaurants. It is also home to a variety of parks and recreational areas, making it a great place for outdoor activities.
The average rent for an apartment in Rochester is $971. The cost of rent varies depending on several factors, including location, size, and quality.
The average rent has decreased by 0.00% over the past year.
Last Updated March 25, 2024
Get updates straight to your inbox
Whenever this data is updated, you'll be the first to know. Don't miss out on crucial market insights.
Average monthly rent graph in Rochester Pennsylvania | Cost of Living
- The most expensive ZIP code in Rochester is 15074 with an average price of $932.
- The cheapest ZIP code in Rochester is 15074 with an average price of $932.
Rochester ZIP codes with the highest, most expensive rent
| # | ZIP Code | Average Rent |
|---|---|---|
| 1 | 15074 | $932 |
Live near Rochester, Pennsylvania's Top Sights and Attractions
Green Valley Township Park is a scenic outdoor destination located in the rolling hills of Pennsylvania. It features a variety of recreational activities, including a large playground, walking trails, picnic areas, and a fishing pond. The park also has a pavilion and a gazebo, perfect for hosting special events. Visitors can also take advantage of the park's basketball court, horseshoe pits, and volleyball court. The park is surrounded by lush greenery and is a great spot to enjoy a peaceful day outdoors.
Riverfront Park is a picturesque outdoor area located along the banks of a river. It features a variety of activities, including walking trails, a playground, picnic areas, and a boat launch. The park also has a large amphitheater, which hosts concerts and other events throughout the year. The park is a popular spot for fishing, kayaking, and other water activities. In addition, it offers stunning views of the surrounding landscape and is a great place to relax and enjoy nature.
North Rochester Ballfield is a large outdoor sports complex located in a rural area. It features two full-sized baseball fields, a batting cage, and a concession stand. The fields are well-maintained and have a grass infield and dirt outfields. The batting cage is equipped with a pitching machine and is open to the public. The concession stand offers a variety of snacks and drinks. The complex is surrounded by a large parking lot and is open to the public for recreational use.
Tri County Commerce Park is a sprawling outdoor complex located in the rolling hills of Pennsylvania. It features a variety of activities, including a large lake for fishing, a disc golf course, a nature trail, and a picnic area. There is also a playground, a basketball court, and a pavilion for special events. The park is open year-round and offers a variety of recreational activities for visitors of all ages.
Rochester, Pennsylvania area median rent change by ZIP code map
Get updates straight to your inbox
Whenever this data is updated, you'll be the first to know. Don't miss out on crucial market insights.
How does Rochester compare to other cities in Pennsylvania?
| city | median price |
|---|---|
| Willow Grove | $2,175 |
| King of Prussia | $2,155 |
| Hartstown | $1,525 |
| McKees Rocks | $1,355 |
| Nanticoke | $1,200 |
Average household income in Rochester area graph - US Census
Get updates straight to your inbox
Whenever this data is updated, you'll be the first to know. Don't miss out on crucial market insights.
The median household income in Rochester in 2021 was $35,088. This represents a 5.1% change from 2011 when the median was $33,395.
| # | category | percent |
|---|---|---|
| 0 | Less than $10,000 | 15.6% |
| 1 | $10,000 to $14,999 | 6.5% |
| 2 | $15,000 to $19,999 | 6.3% |
| 3 | $20,000 to $24,999 | 6.1% |
| 4 | $25,000 to $29,999 | 7.0% |
| 5 | $30,000 to $34,999 | 7.1% |
| 6 | $35,000 to $39,999 | 8.3% |
| 7 | $40,000 to $44,999 | 5.2% |
| 8 | $45,000 to $49,999 | 10.1% |
| 9 | $50,000 to $59,999 | 7.8% |
| 10 | $60,000 to $74,999 | 2.4% |
| 11 | $75,000 to $99,999 | 10.1% |
| 12 | $100,000 to $124,999 | 2.5% |
| 13 | $125,000 to $149,999 | 1.9% |
| 14 | $150,000 to $199,999 | 2.7% |
| 15 | $200,000 or more | 0.4% |
Neighborhoods in Rochester
We currently do not have this data but we are working to add this soon.