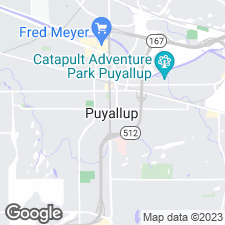
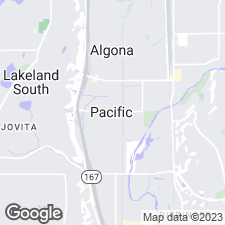
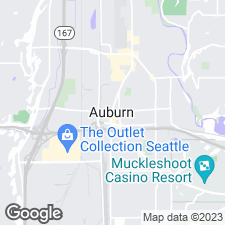
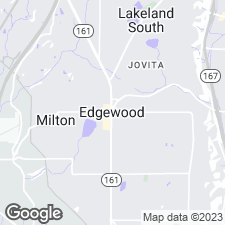
Rental market snapshot for Sumner, Washington
Sumner, Washington Rental Property Market Overview
Sumner, Washington is a small city located in Pierce County. It has a population of 10,673 as of 2021, according to the US Census. Sumner is known for its historic downtown, which features a variety of shops and restaurants. The city also has a number of parks and trails, making it a great place to explore the outdoors. Sumner is a great place to live, work, and play.
The average rent for an apartment in Sumner is $2,462. The cost of rent varies depending on several factors, including location, size, and quality.
The average rent has decreased by 0.00% over the past year.
Last Updated March 25, 2024
Get updates straight to your inbox
Whenever this data is updated, you'll be the first to know. Don't miss out on crucial market insights.
Average monthly rent graph in Sumner Washington | Cost of Living
We currently do not have this data but we are working to add this soon.
Sumner ZIP codes with the highest, most expensive rent
We currently do not have this data but we are working to add this soon.
Live near Sumner, Washington's Top Sights and Attractions
Seibenthaler Park is a beautiful outdoor space located in a small town in the Pacific Northwest. It features a large grassy area, perfect for picnics and outdoor activities, as well as a playground and walking trails. The park also has a pond with a dock, where visitors can go fishing or take a leisurely boat ride. The park is surrounded by lush trees and shrubs, providing a peaceful and tranquil atmosphere.
Loyalty Park is a scenic waterfront park located on the Puget Sound. It features a large grassy area, a playground, picnic tables, and a beach with a boat launch. Visitors can enjoy stunning views of the Olympic Mountains, the Tacoma Narrows Bridge, and the Vashon Island ferry. There are also walking trails, a fishing pier, and a variety of wildlife.
Rainier View Park is a beautiful outdoor attraction located in the foothills of the Cascade Mountains. It offers stunning views of Mount Rainier, the highest peak in the Cascade Range. The park features a variety of trails for hiking, biking, and horseback riding, as well as picnic areas and playgrounds. There are also several scenic overlooks, perfect for taking in the breathtaking views of the mountain and surrounding landscape.
Rueben Knoblauch Heritage Park is a beautiful park located in a small town. It features a variety of outdoor activities, including a playground, picnic area, walking trails, and a pond. The park also has a large open grassy area, perfect for playing sports or just relaxing in the sun. The park is surrounded by lush trees and shrubs, providing a peaceful and tranquil atmosphere. Visitors can also enjoy the many sculptures and monuments that are scattered throughout the park, honoring the town's history and heritage.
Ryan House is a historic home located in a small town in the Pacific Northwest. Built in 1891, the house is a two-story, Queen Anne-style Victorian with a wrap-around porch and a turret. Inside, visitors can explore the original furnishings, including a grand piano, a wood-burning stove, and a variety of antiques. The house also features a large collection of photographs and artifacts from the early days of the town. Outside, visitors can stroll through the gardens, which feature a variety of plants and flowers.
Rueben Knoblauch Heritage Park is a beautiful park located in a small town. It features a variety of outdoor activities, including a playground, picnic area, walking trails, and a pond. The park also has a large open grassy area, perfect for playing sports or just relaxing in the sun. The park is surrounded by lush trees and shrubs, providing a peaceful and tranquil atmosphere. Visitors can also enjoy the many sculptures and monuments that are scattered throughout the park, honoring the town's history and heritage.
Riverbend Park is a scenic outdoor destination located in the foothills of the Cascade Mountains. It features a variety of recreational activities, including walking and biking trails, fishing, picnicking, and camping. The park also has a playground, a boat launch, and a disc golf course. The park is surrounded by lush forests and offers stunning views of the surrounding mountains and valleys. Visitors can also explore the nearby White River, which is home to a variety of wildlife.
White River Trail Extension is a scenic walking and biking trail that follows the White River through the lush forests of the Pacific Northwest. The trail is approximately 4 miles long and features a variety of terrain, from flat, easy sections to more challenging hills. Along the way, visitors can take in stunning views of the river and the surrounding landscape, as well as spot wildlife such as bald eagles, ospreys, and beavers. The trail is also a great spot for fishing, bird watching, and picnicking.
Sumner, Washington area median rent change by ZIP code map
Get updates straight to your inbox
Whenever this data is updated, you'll be the first to know. Don't miss out on crucial market insights.
How does Sumner compare to other cities in Washington?
| city | median price |
|---|---|
| North Bend | $3,100 |
| Bainbridge Island | $2,529 |
| Kent | $2,518 |
| Gig Harbor | $2,300 |
| Bremerton | $1,795 |
| Port Orchard | $1,745 |
| Sequim | $1,500 |
| Liberty Lake | $1,479 |
Average household income in Sumner area graph - US Census
Get updates straight to your inbox
Whenever this data is updated, you'll be the first to know. Don't miss out on crucial market insights.
The median household income in Sumner in 2021 was $77,601. This represents a 50.1% change from 2011 when the median was $51,692.
| # | category | percent |
|---|---|---|
| 0 | Less than $10,000 | 2.5% |
| 1 | $10,000 to $14,999 | 2.7% |
| 2 | $15,000 to $19,999 | 2.7% |
| 3 | $20,000 to $24,999 | 6.0% |
| 4 | $25,000 to $29,999 | 4.0% |
| 5 | $30,000 to $34,999 | 3.4% |
| 6 | $35,000 to $39,999 | 4.5% |
| 7 | $40,000 to $44,999 | 2.1% |
| 8 | $45,000 to $49,999 | 2.2% |
| 9 | $50,000 to $59,999 | 12.1% |
| 10 | $60,000 to $74,999 | 13.1% |
| 11 | $75,000 to $99,999 | 16.9% |
| 12 | $100,000 to $124,999 | 10.0% |
| 13 | $125,000 to $149,999 | 6.9% |
| 14 | $150,000 to $199,999 | 5.2% |
| 15 | $200,000 or more | 5.7% |
Neighborhoods in Sumner
We currently do not have this data but we are working to add this soon.
