Rental market snapshot for Black Jack, Missouri
Black Jack, Missouri Rental Property Market Overview
Black Jack, Missouri is a small city located in St. Louis County with a population of 6,593 as of 2021, according to the US Census. It is a suburban community with a mix of residential and commercial areas. The city is home to several parks and recreational areas, including the Black Jack Park and the Black Jack Golf Course. The city is also home to several schools, including the Black Jack Elementary School and the Black Jack Middle School. Black Jack is a great place to live, work, and play.
The average rent for an apartment in Black Jack is $1,605. The cost of rent varies depending on several factors, including location, size, and quality.
The average rent has decreased by 0.00% over the past year.
Last Updated March 25, 2024
Get updates straight to your inbox
Whenever this data is updated, you'll be the first to know. Don't miss out on crucial market insights.
Average monthly rent graph in Black Jack Missouri | Cost of Living
- The most expensive ZIP code in Black Jack is 63033 with an average price of $1,585.
- The cheapest ZIP code in Black Jack is 63033 with an average price of $1,585.
Black Jack ZIP codes with the highest, most expensive rent
| # | ZIP Code | Average Rent |
|---|---|---|
| 1 | 63033 | $1,585 |
Live near Black Jack, Missouri's Top Sights and Attractions
Evangelista Park is a large outdoor recreational area located in a small town in Missouri. It features a variety of activities and attractions, including a large lake, walking trails, picnic areas, playgrounds, and a disc golf course. The park also has a variety of wildlife, including deer, birds, and other animals. The park is a popular destination for families, couples, and individuals looking to enjoy the outdoors.
Harold J Evangelista Park is a large outdoor recreational area located in a small town in Missouri. It features a variety of activities for visitors to enjoy, including a playground, walking trails, picnic areas, and a large pond. The park also has a variety of wildlife, including ducks, geese, and other birds. Visitors can also enjoy fishing in the pond, as well as a variety of other activities. The park is a great place to spend a day outdoors, enjoying the fresh air and the beauty of nature.
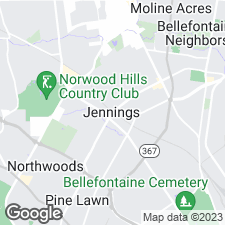
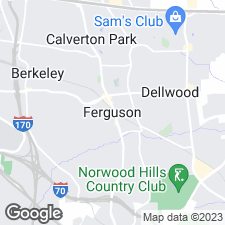
Black Jack, Missouri area median rent change by ZIP code map
Get updates straight to your inbox
Whenever this data is updated, you'll be the first to know. Don't miss out on crucial market insights.
How does Black Jack compare to other cities in Missouri?
| city | median price |
|---|---|
| Imperial | $1,800 |
| Kearney | $1,675 |
| Barnhart | $1,600 |
| Maryland Heights | $1,575 |
| University City | $1,250 |
| Oak Grove | $1,230 |
| Springfield | $1,025 |
| Waynesville | $1,000 |
Average household income in Black Jack area graph - US Census
Get updates straight to your inbox
Whenever this data is updated, you'll be the first to know. Don't miss out on crucial market insights.
The median household income in Black Jack in 2021 was $57,115. This represents a -6.1% change from 2011 when the median was $60,825.
| # | category | percent |
|---|---|---|
| 0 | Less than $10,000 | 1.4% |
| 1 | $10,000 to $14,999 | 3.4% |
| 2 | $15,000 to $19,999 | 4.7% |
| 3 | $20,000 to $24,999 | 9.3% |
| 4 | $25,000 to $29,999 | 10.1% |
| 5 | $30,000 to $34,999 | 0.7% |
| 6 | $35,000 to $39,999 | 1.7% |
| 7 | $40,000 to $44,999 | 6.4% |
| 8 | $45,000 to $49,999 | 1.1% |
| 9 | $50,000 to $59,999 | 12.4% |
| 10 | $60,000 to $74,999 | 9.5% |
| 11 | $75,000 to $99,999 | 11.8% |
| 12 | $100,000 to $124,999 | 8.9% |
| 13 | $125,000 to $149,999 | 12.1% |
| 14 | $150,000 to $199,999 | 5.9% |
| 15 | $200,000 or more | 0.6% |
Neighborhoods in Black Jack
We currently do not have this data but we are working to add this soon.