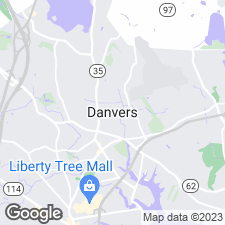
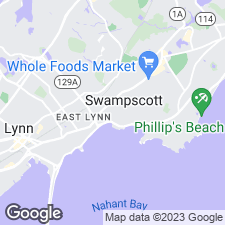
Rental market snapshot for Peabody, Massachusetts
Peabody, Massachusetts Rental Property Market Overview
Peabody, Massachusetts is a city located in Essex County with a population of 54,119 as of 2021, according to the US Census. It is located in the North Shore region of Massachusetts, just north of Boston. Peabody is known for its historic downtown area, which includes a variety of shops, restaurants, and attractions. The city is also home to a number of parks and recreational areas, including the Peabody Historical Society and Museum. Peabody is a great place to live, work, and play, and is a great place to call home.
The average rent for an apartment in Peabody is $2,584. The cost of rent varies depending on several factors, including location, size, and quality.
The average rent has decreased by 0.00% over the past year.
Last Updated March 25, 2024
Get updates straight to your inbox
Whenever this data is updated, you'll be the first to know. Don't miss out on crucial market insights.
Average monthly rent graph in Peabody Massachusetts | Cost of Living
- The most expensive ZIP code in Peabody is 01960 with an average price of $2,410.
- The cheapest ZIP code in Peabody is 01960 with an average price of $2,410.
Peabody ZIP codes with the highest, most expensive rent
| # | ZIP Code | Average Rent |
|---|---|---|
| 1 | 01960 | $2,410 |
Live near Peabody, Massachusetts's Top Sights and Attractions
Sidneys Pond Conservation Area is a tranquil natural area located in the suburbs of Massachusetts. It features a large pond surrounded by lush woodlands, meadows, and wetlands. Visitors can explore the area on foot or by bike, taking in the sights and sounds of the wildlife. There are several trails that wind through the area, offering a variety of scenic views. Birdwatchers can observe a variety of species, including ducks, geese, and herons. The area also features a picnic area and a playground, making it a great spot for families to spend the day.
Connelly Park is a large public park located in a suburban area. It features a variety of outdoor activities, including walking and biking trails, a playground, a pond, and a picnic area. The park also has a large open field, perfect for sports and other activities. There are also several benches and tables scattered throughout the park, making it a great spot to relax and enjoy the outdoors.
Leather City Common is a historic park located in the heart of a bustling city. It features a large grassy area surrounded by mature trees, providing a peaceful respite from the hustle and bustle of the city. The park also features a large fountain, a gazebo, and a variety of benches and tables for visitors to enjoy. The park is a popular spot for picnics, outdoor concerts, and other events. It is also a great place to take a leisurely stroll and enjoy the beauty of nature.
Tanner Skatepark is an outdoor skatepark located in a suburban area. It features a variety of obstacles and ramps for skateboarders, BMX riders, and inline skaters. The park has a large bowl, a mini-ramp, and several street-style obstacles. It also has a picnic area and a playground for younger visitors. The park is open year-round and is free to the public.
Lt Ross Park is a large outdoor recreation area located in the suburbs of Massachusetts. It features a variety of activities, including a playground, walking trails, a fishing pond, and a picnic area. The park also has a large open field, perfect for sports and other activities. The park is surrounded by lush trees and is a great spot for a relaxing day outdoors.
OConnor Park is a large outdoor recreation area located in a suburban area. It features a variety of activities, including a playground, a basketball court, a baseball field, a walking path, and picnic areas. The park also has a pond with a fountain, a gazebo, and a pavilion. The park is surrounded by trees and lush green grass, making it a great spot for a picnic or a leisurely stroll.
Lakeshore Park is a beautiful outdoor attraction located in Massachusetts. It features a large lake surrounded by lush green trees and rolling hills. Visitors can enjoy a variety of activities such as fishing, boating, swimming, and picnicking. There are also several walking trails and a playground for children. The park is a great place to relax and enjoy nature, and it is a popular destination for families and friends.
Raddin Park is a family-friendly outdoor attraction located in a picturesque setting. It features a variety of activities, including a playground, picnic areas, walking trails, and a pond. The park also has a large open field, perfect for playing sports or just relaxing. There are also several benches and tables scattered throughout the park, making it a great spot for a picnic or just to take in the scenery. The park is well-maintained and provides a great place to spend time with family and friends.
Robin Road Conservation Area is a beautiful natural area located in the suburbs of Massachusetts. It features a variety of trails for walking, running, and biking, as well as a pond and marshland for fishing and bird watching. The area is also home to a variety of wildlife, including deer, foxes, and other small mammals. The conservation area is a great place to spend a day outdoors, enjoying the peaceful atmosphere and the beauty of nature.
Symphony Road Park is a beautiful outdoor recreation area located in a quiet suburban neighborhood. It features a large grassy field, perfect for picnics and outdoor activities, as well as a playground with swings and slides. There is also a walking path that winds through the park, lined with trees and benches for visitors to enjoy. The park also has a pond, where visitors can fish or take a leisurely stroll.
Peabody, Massachusetts area median rent change by ZIP code map
Get updates straight to your inbox
Whenever this data is updated, you'll be the first to know. Don't miss out on crucial market insights.
How does Peabody compare to other cities in Massachusetts?
| city | median price |
|---|---|
| Millis | $4,300 |
| Lincoln | $4,139 |
| Charlton | $3,304 |
| Concord | $3,215 |
| Braintree Town | $2,800 |
| Framingham | $2,517 |
| Randolph | $2,300 |
| Gardner | $1,645 |
Average household income in Peabody area graph - US Census
Get updates straight to your inbox
Whenever this data is updated, you'll be the first to know. Don't miss out on crucial market insights.
The median household income in Peabody in 2021 was $83,570. This represents a 24.6% change from 2011 when the median was $67,052.
| # | category | percent |
|---|---|---|
| 0 | Less than $10,000 | 5.3% |
| 1 | $10,000 to $14,999 | 2.6% |
| 2 | $15,000 to $19,999 | 4.1% |
| 3 | $20,000 to $24,999 | 2.5% |
| 4 | $25,000 to $29,999 | 4.3% |
| 5 | $30,000 to $34,999 | 2.9% |
| 6 | $35,000 to $39,999 | 3.2% |
| 7 | $40,000 to $44,999 | 2.6% |
| 8 | $45,000 to $49,999 | 3.2% |
| 9 | $50,000 to $59,999 | 7.0% |
| 10 | $60,000 to $74,999 | 9.1% |
| 11 | $75,000 to $99,999 | 14.5% |
| 12 | $100,000 to $124,999 | 12.7% |
| 13 | $125,000 to $149,999 | 7.0% |
| 14 | $150,000 to $199,999 | 9.4% |
| 15 | $200,000 or more | 9.6% |
Neighborhoods in Peabody
We currently do not have this data but we are working to add this soon.
