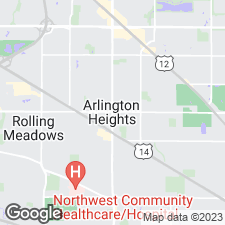
Rental market snapshot for Mount Prospect, Illinois
Mount Prospect, Illinois Rental Property Market Overview
Mount Prospect, Illinois is a vibrant and diverse community located in the northern suburbs of Chicago. According to the US Census, the population of Mount Prospect in 2021 is 55,541. The town is known for its excellent schools, parks, and recreational activities. It is also home to a variety of businesses, restaurants, and shopping centers. With its convenient location and strong sense of community, Mount Prospect is a great place to live and work.
The average rent for an apartment in Mount Prospect is $1,997. The cost of rent varies depending on several factors, including location, size, and quality.
The average rent has decreased by 0.00% over the past year.
Last Updated March 25, 2024
Get updates straight to your inbox
Whenever this data is updated, you'll be the first to know. Don't miss out on crucial market insights.
Average monthly rent graph in Mount Prospect Illinois | Cost of Living
- The most expensive ZIP code in Mount Prospect is 60056 with an average price of $1,987.
- The cheapest ZIP code in Mount Prospect is 60056 with an average price of $1,987.
Mount Prospect ZIP codes with the highest, most expensive rent
| # | ZIP Code | Average Rent |
|---|---|---|
| 1 | 60056 | $1,987 |
Live near Mount Prospect, Illinois's Top Sights and Attractions
Lions Memorial Park is a beautiful outdoor space located in a suburban area. It features a large lake, walking trails, and a variety of recreational activities. The park also has a playground, picnic areas, and a pavilion. The lake is stocked with fish, and visitors can rent boats and canoes to explore the lake. The park also has a disc golf course, and a variety of sports fields and courts. The park is a great place to spend a day outdoors, and it is a popular spot for families and friends to gather.
Melas Park is a sprawling park located in the suburbs of Illinois. It features a variety of outdoor activities, such as a large playground, a basketball court, a baseball diamond, a picnic area, and a walking path. The park also has a lake, which is a popular spot for fishing and boating. There are also several pavilions and a gazebo, which are perfect for hosting events or simply enjoying the outdoors. The park is also home to a variety of wildlife, including ducks, geese, and other birds.
Burning Bush Trails Park is a beautiful outdoor destination located in the suburbs of Illinois. It features a variety of trails for hiking, biking, and running, as well as a large pond for fishing and canoeing. The park also has a playground, picnic areas, and a pavilion for special events. The park is surrounded by lush greenery and is a great place to relax and enjoy nature.
Moehling Park is a scenic outdoor area located in a suburban area. It features a large pond, walking paths, and a variety of wildlife. The park also has a playground, picnic areas, and a gazebo. There is also a fishing pier, a disc golf course, and a skate park. The park is a great place to spend a day outdoors, enjoying the natural beauty of the area.
Robert T Jackson Clearwater Park is a beautiful outdoor destination located in the suburbs of Illinois. It features a large lake, lush green lawns, and plenty of walking trails. Visitors can enjoy a variety of activities, including fishing, boating, and picnicking. The park also offers a playground, a disc golf course, and a variety of sports courts. In addition, the park has a pavilion, a gazebo, and a picnic shelter, making it a great spot for family gatherings and special events.
Redwood Park is a picturesque outdoor area located in a suburban setting. It features a variety of recreational activities, including a playground, picnic areas, walking trails, and a fishing pond. The park also has a large open field, perfect for sports and other outdoor activities. The park is surrounded by tall trees, providing a peaceful and serene atmosphere. Visitors can also enjoy the beautiful views of the nearby lake and wildlife.
Melas Park Softball Concession Stand is a popular attraction located in a picturesque park. It offers a variety of snacks and refreshments to visitors, including hot dogs, hamburgers, chips, candy, and ice cream. The concession stand also features a variety of cold drinks, including soda, juice, and water. The stand is open during the summer months and is a great place to grab a snack and enjoy the beautiful park.
Marvin S Weiss Community Center is a vibrant and welcoming facility located in a suburban area. It offers a variety of activities and amenities, including a gymnasium, fitness center, swimming pool, and meeting rooms. The center also hosts a variety of events, such as art classes, dance classes, and sports leagues. The center is a great place for families to come together and enjoy activities, as well as for individuals to stay active and engaged in the community.
Busse Park is a sprawling, lush green space located in the suburbs of Illinois. It features a variety of outdoor activities, including walking and biking trails, a fishing pond, and a playground. There is also a picnic area and a pavilion, perfect for hosting events or family gatherings. The park is home to a variety of wildlife, including birds, deer, and other animals. The park also has a variety of trees, shrubs, and flowers, making it a great spot for nature lovers.
Kopp Park is a large outdoor recreational area located in the suburbs of Illinois. It features a variety of amenities, including a large playground, a picnic area, a walking path, a basketball court, and a baseball field. The park also has a pond with a fishing dock, a gazebo, and a pavilion. The park is surrounded by lush greenery and is a great spot for a family outing or a picnic.
Mount Prospect, Illinois area median rent change by ZIP code map
Get updates straight to your inbox
Whenever this data is updated, you'll be the first to know. Don't miss out on crucial market insights.
How does Mount Prospect compare to other cities in Illinois?
| city | median price |
|---|---|
| Melrose Park | $2,400 |
| Lombard | $2,314 |
| Des Plaines | $2,225 |
| Yorkville | $2,200 |
| Calumet Park | $1,400 |
| Itasca | $1,395 |
| Calumet City | $1,250 |
| Riverdale | $1,080 |
Average household income in Mount Prospect area graph - US Census
Get updates straight to your inbox
Whenever this data is updated, you'll be the first to know. Don't miss out on crucial market insights.
The median household income in Mount Prospect in 2021 was $92,477. This represents a 35.2% change from 2011 when the median was $68,375.
| # | category | percent |
|---|---|---|
| 0 | Less than $10,000 | 3.8% |
| 1 | $10,000 to $14,999 | 2.7% |
| 2 | $15,000 to $19,999 | 2.8% |
| 3 | $20,000 to $24,999 | 4.4% |
| 4 | $25,000 to $29,999 | 3.4% |
| 5 | $30,000 to $34,999 | 2.6% |
| 6 | $35,000 to $39,999 | 4.0% |
| 7 | $40,000 to $44,999 | 3.1% |
| 8 | $45,000 to $49,999 | 3.2% |
| 9 | $50,000 to $59,999 | 6.7% |
| 10 | $60,000 to $74,999 | 9.2% |
| 11 | $75,000 to $99,999 | 13.0% |
| 12 | $100,000 to $124,999 | 11.2% |
| 13 | $125,000 to $149,999 | 9.5% |
| 14 | $150,000 to $199,999 | 9.8% |
| 15 | $200,000 or more | 10.7% |
Neighborhoods in Mount Prospect
We currently do not have this data but we are working to add this soon.

