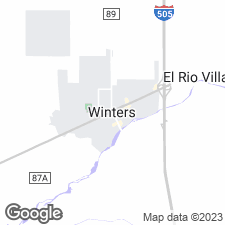
Rental market snapshot for Woodland, California
Woodland, California Rental Property Market Overview
Woodland, California is a city located in Yolo County, with a population of 61,398 as of 2021 according to the US Census. It is located in the Sacramento Valley, and is known for its agricultural industry and its historic downtown. Woodland is home to a variety of parks, trails, and other outdoor recreation areas, as well as a vibrant arts and culture scene. The city is also home to several educational institutions, including Woodland Community College and California State University, Sacramento. With its rich history and vibrant culture, Woodland is a great place to live and visit. (Source: US Census, 2021)
The average rent for an apartment in Woodland is $3,399. The cost of rent varies depending on several factors, including location, size, and quality.
The average rent has decreased by 0.00% over the past year.
Last Updated March 25, 2024
Get updates straight to your inbox
Whenever this data is updated, you'll be the first to know. Don't miss out on crucial market insights.
Average monthly rent graph in Woodland California | Cost of Living
- The most expensive ZIP code in Woodland is 91364 with an average price of $4,036.
- The cheapest ZIP code in Woodland is 95695 with an average price of $2,071.
Woodland ZIP codes with the highest, most expensive rent
| # | ZIP Code | Average Rent |
|---|---|---|
| 1 | 91364 | $4,036 |
| 2 | 95776 | $2,627 |
| 3 | 95695 | $2,071 |
Live near Woodland, California's Top Sights and Attractions
Charles Brooks Community Swim Center is a public aquatic facility located in Woodland, California. It features a 25-meter pool, a shallow leisure pool, a diving well, and a splash pad. The facility also offers a variety of recreational activities, including swimming lessons, water aerobics, and open swim. The center also has a snack bar, locker rooms, and a sun deck.
Pioneer Park is a large outdoor recreational area located in a small town in Northern California. It features a variety of activities, including a playground, picnic areas, a lake, and a walking trail. The park also has a large open grassy area, perfect for playing sports or just relaxing. There are also several historic buildings located in the park, including a one-room schoolhouse and a blacksmith shop. The park is a great place to spend a day outdoors, enjoying the fresh air and the beautiful scenery.
County of Yolo is a popular attraction located in Woodland, California. It is a large outdoor park that features a variety of activities and amenities. Visitors can enjoy a variety of outdoor activities such as fishing, boating, camping, hiking, biking, and picnicking. The park also features a variety of wildlife, including deer, foxes, and birds. There are also several playgrounds and picnic areas for visitors to enjoy. In addition, the park has a number of historical sites, including a replica of the original Yolo County Courthouse.
Dick Klenhard Park is a beautiful outdoor area located in Northern California. It features a large grassy area perfect for picnics and outdoor activities, as well as a playground and a walking path. The park also has a pond with ducks and geese, and a variety of trees and shrubs. There is also a large gazebo and a picnic area with tables and benches. The park is a great place to spend a day outdoors with family and friends.
Rick Gonzales Sr Park is a beautiful park located in Woodland, California. It features a large playground, picnic areas, and a walking path. The park also has a basketball court, a baseball field, and a soccer field. There is a large pond with ducks and geese, and a gazebo for relaxing. The park is surrounded by trees and lush green grass, making it a great place to spend a day outdoors.
John Ferns Park is a beautiful outdoor space located in the heart of a small town. It features a large grassy area, perfect for picnics and outdoor activities, as well as a playground, basketball court, and a walking path. The park also has a pond with ducks and geese, and plenty of trees and shrubs to provide shade. There is also a pavilion with picnic tables, perfect for family gatherings or special events.
Joseph Schneider Park is a beautiful outdoor area located in Woodland, California. It features a large grassy area with plenty of trees and benches, perfect for picnics and outdoor activities. There is also a playground for children, a large pond with ducks and geese, and a walking path that winds through the park. The park is a great place to relax and enjoy nature, with plenty of wildlife and lush vegetation.
Streng Pond Park is a tranquil oasis located in a small town. It features a large pond surrounded by lush greenery, with a walking path that circles the pond. There are plenty of benches and picnic tables, as well as a playground and a gazebo. The park is a great spot for a leisurely stroll, a picnic, or a game of catch. It's also a popular spot for bird watching, as the pond is home to a variety of waterfowl.
Wayne Cline Park is a beautiful park located in a rural area. It features a large grassy area with plenty of trees for shade, a playground, and a walking path. There is also a picnic area with tables and benches, and a basketball court. The park is a great place to take a leisurely stroll, have a picnic, or just relax in the shade.
Woodside Park is a beautiful outdoor recreational area located in the foothills of Northern California. It features a variety of activities, including hiking trails, picnic areas, playgrounds, and a large lake. The park is surrounded by lush greenery and is a great place to spend a day outdoors. There are also plenty of opportunities for bird watching, fishing, and other outdoor activities. Visitors can also take advantage of the park's many amenities, such as restrooms, a snack bar, and a campground.
Woodland, California area median rent change by ZIP code map
Get updates straight to your inbox
Whenever this data is updated, you'll be the first to know. Don't miss out on crucial market insights.
How does Woodland compare to other cities in California?
| city | median price |
|---|---|
| San Rafael | $2,988 |
| Oak Park | $2,800 |
| Pacific Grove | $2,600 |
| Westminster | $2,598 |
| Lake Elsinore | $2,515 |
| Gardena | $2,395 |
| Salinas | $2,275 |
| McKinleyville | $1,900 |
| Arcata | $1,800 |
Average household income in Woodland area graph - US Census
Get updates straight to your inbox
Whenever this data is updated, you'll be the first to know. Don't miss out on crucial market insights.
The median household income in Woodland in 2021 was $78,279. This represents a 42.0% change from 2011 when the median was $55,139.
| # | category | percent |
|---|---|---|
| 0 | Less than $10,000 | 3.5% |
| 1 | $10,000 to $14,999 | 3.4% |
| 2 | $15,000 to $19,999 | 3.0% |
| 3 | $20,000 to $24,999 | 4.2% |
| 4 | $25,000 to $29,999 | 3.5% |
| 5 | $30,000 to $34,999 | 3.7% |
| 6 | $35,000 to $39,999 | 3.8% |
| 7 | $40,000 to $44,999 | 4.1% |
| 8 | $45,000 to $49,999 | 3.8% |
| 9 | $50,000 to $59,999 | 7.6% |
| 10 | $60,000 to $74,999 | 11.9% |
| 11 | $75,000 to $99,999 | 13.3% |
| 12 | $100,000 to $124,999 | 11.4% |
| 13 | $125,000 to $149,999 | 6.6% |
| 14 | $150,000 to $199,999 | 9.9% |
| 15 | $200,000 or more | 6.2% |

